


-
 +20 +7
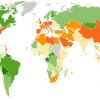
We’ve Consumed More Than the Earth Can Produce This Year
It may feel like Christmas comes earlier each year, but there’s a less joyful day that really is moving closer on the calendar. Earth Overshoot Day is the day when—according to estimates—the total combined consumption of all human activity on Earth in a year overtakes the planet’s ability to generate those resources for that year. How is it measured?
-
 +25 +7
Brewing Multivariate Beer
I was toying around with the idea of multivariate beer, where the ingredients varied by county demographics. Could I taste the difference? Here's how the experiment went.
-
 +24 +4
Footprints of Spain’s tourists in Summer 2014
Minute by minute, watch how tourists spent their money across Spain and some of its biggest cities with this interactive visualization. BBVA has been analyzing territorial dynamics based on anonymized data of credit card transactions for more than 4 years. This data visualization has been crafted to allow you to unveil the where, when and what; ever wondered when the French buy their food, or which places the Germans flock to on their holidays? Sit back and discover the dynamics of spending i
-
 +18 +5
What are migration levels like in your area? (Interactive map of the UK)
Migration is a topic which often features in newspaper column inches and on our television screens. Yesterday it was revealed that over the last year net migration (the balance between immigration and emigration) reached its highest ever level of 330,000. Also, it was reported that across the UK 1 in 8 people were born outside the UK.
-
 +2 +1
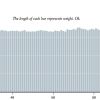
+2 +1Bar Chart Baselines Start at Zero
There are visualization rules and there are visualization suggestions. Most are suggestions. The ones that are rules exist because of how our brains process visual information. This zero baseline thing is a rule.
-
 +21 +1
Unaffordable country: where can you afford to buy a house?
Buyers in England and Wales forced to spend up to 12 times their income as gap between earnings and house prices widens
-
 +2 +1
+2 +1Time Maps: Visualizing Discrete Events Across Many Timescales
Despite the simplicity of discrete event data, it’s hard to visualize many events over a long time period without hiding details about shorter timescales.
-
 +39 +4
Follow the flow of Syrian civilians from the Middle East to Western Europe
This map follows the growing population of Syrian civilians who have fled the country's civil war.
-
 +17 +3
1 graphic that shows how we are all related
Scientists have released a new version of the tree of life, showing everything we know about how the living things of Earth are related to one another. With 2.3 million species and counting, it's the most complete model of its kind - but there's a lot more work to do. Everything that lives or ever lived on Earth is somehow related to everything else. But figuring out just how all those critters and plants and pond scums fit together has posed a bit of a challenge.
-
Interactive+17 +6
World Air Quality Index
Air pollution in the world: real time air quality map.
-
 +3 +1
+3 +1Worldometers - real time world statistics
Live world statistics on population, government and economics, society and media, environment, food, water, energy and health.
-
 +28 +1
How Gun Traffickers Get Around State Gun Laws
In California, some gun smugglers use FedEx. In Chicago, smugglers drive just across the state line into Indiana, buy a gun and drive back. In Orlando, Fla., smugglers have been known to fill a $500 car with guns and send it on a ship to crime rings in Puerto Rico. In response to mass shootings in the last few years, more than 20 states, including some of the nation’s biggest, have passed new laws restricting how people can buy and carry guns.
-
 +24 +1
What Americans thought of Jewish refugees on the eve of World War II
The results of the poll illustrated above by the useful Twitter account @HistOpinion were published in the pages of Fortune magazine in July 1938. Fewer than 5 percent of Americans surveyed at the time believed that the United States should raise its immigration quotas or encourage political refugees fleeing fascist states in Europe — the vast majority of whom were Jewish — to voyage across the Atlantic. Two-thirds of the respondents agreed with the...
-
 +42 +1
Here's a map of all the mass shootings in 2015
As details surrounding the San Bernardino, California, shooting gradually emerged Wednesday evening, President Barack Obama told CBS News that the U.S. has “a pattern now of mass shooting in this country that has no parallel anywhere else in the world.” The mass shooting at a social services agency in San Bernardino left at least 14 dead and 17 others wounded. It is also the deadliest mass shooting in the U.S. since Adam Lanza opened fire at Sandy...
-
 +25 +1
Image Shows How Dolphins See People
What does a submerged man look like to a dolphin? A new image reveals what a marine mammal saw. By Jennifer Viegas.
-
 +22 +1
The rise and decline of Wikipedia?
The Rise and Decline of an Open Collaboration System: How Wikipedia’s reaction to popularity is causing its decline (PDF)
-
 +16 +1
How You Will Die
So far we’ve seen when you will die and how other people tend to die. Now let’s put the two together to see how and when you will die, given your sex, race, and age.
-
 +40 +1
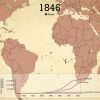
This Haunting Animation Maps the Journeys of 15,790 Slave Ships in Two Minutes
Usually, when we say “American slavery” or the “American slave trade,” we mean the American colonies or, later, the United States. But as we discussed in Episode 2 of Slate’s History of American Slavery Academy, relative to the entire slave trade, North America was a bit player. From the trade’s beginning in the 16th century to its conclusion in the 19th...
-
 +41 +1
The Tragic Data Behind Selfie Fatalities
Since 2014, at least 49 deaths have been precipitated by taking a selfie. Breaking down the data behind them yields an interesting story.
-
 +26 +1
Interactive Map Lets You Track How 19th- and Early-20th-Century American Newspapers Covered Any Topic
This interactive map, put together by the Georgia Tech Research Institute and the University of Georgia's eHistory initiative, uses the Library of Congress' database of historical newspapers, Chronicling America, to track frequency of keywords in newspapers and visualize the results across time and space.
Submit a link
Start a discussion