


9 years ago
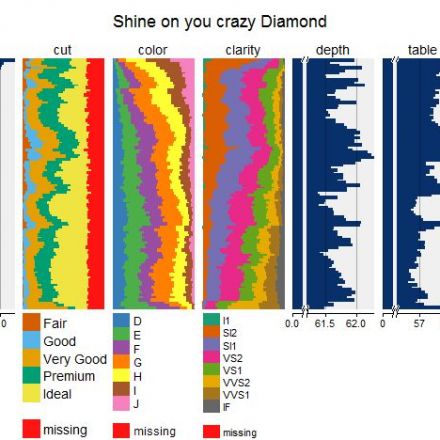
Visualization of large datasets with tabplot
The tableplot is a powerful visualization method to explore and analyse large multivariate datasets. In this vignette, the implementation of tableplots in R is described, and illustrated with the diamonds dataset from the ggplot2 package.
Continue Reading https://cran.r-project.org

Join the Discussion