


7 years ago
W. E. B. Du Bois’s Modernist Data Visualizations of Black Life
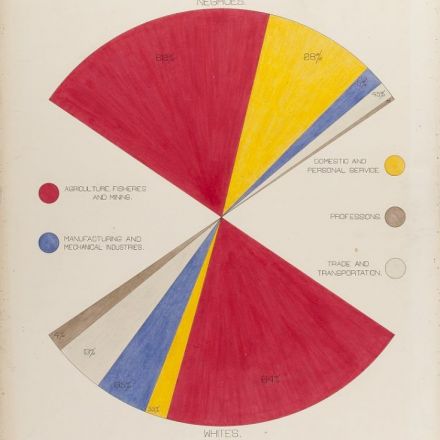
Du Bois’s charts focus on Georgia, tracing the routes of the slave trade to the Southern state, the value of black-owned property between 1875 and 1889, comparing occupations practiced by blacks and whites, and calculating the number of black students in different school courses (2 in business, 2,252 in industrial). By Allison Meier.
Continue Reading http://hyperallergic.com


Join the Discussion